译者:chenhuafu 来源:http://blogs.msdn.com/excel
发表于:2006年7月7日
PivotTable Styles
数据透视表样式
Yesterday we looked at Table Styles. Today, I wanted to revisit PivotTable Styles (see a post here where I introduced PivotTable styles a few months ago – you might want to re-read that before proceeding). This post will be a bit shorter, because most of what I talked about yesterday with respect to Table Styles is also true for PivotTable Styles.
昨天我们关注了列表样式,今天,我想重温数据透视表的样式(单击这里可以看到一篇几个月前我介绍的数据透视表风格的文章——你可能想要在继续阅读本文前重读那篇文章)。本文较短,那是因为昨天我着重谈及列表风格的关系,而列表风格大部分类似于数据透视表风格。
PivotTable Styles have the same design goals as Table Styles, and they also have the same user model and customization story. Here is a shot of the PivotTable Design Tab where users can control the look of the PivotTable (the “Banded Col
数据透视表与列表不仅在样式上具有相同的设计目标,而且用户模型和自定义过程亦相同。下面的图片是数据透视表“设计标签”的截图,用户可以控制数据透视的面貌(图中的“Banded Columns”(条纹列)复选框是一个bug…它必需低于“Banded Rows”(条纹行)复选框)。
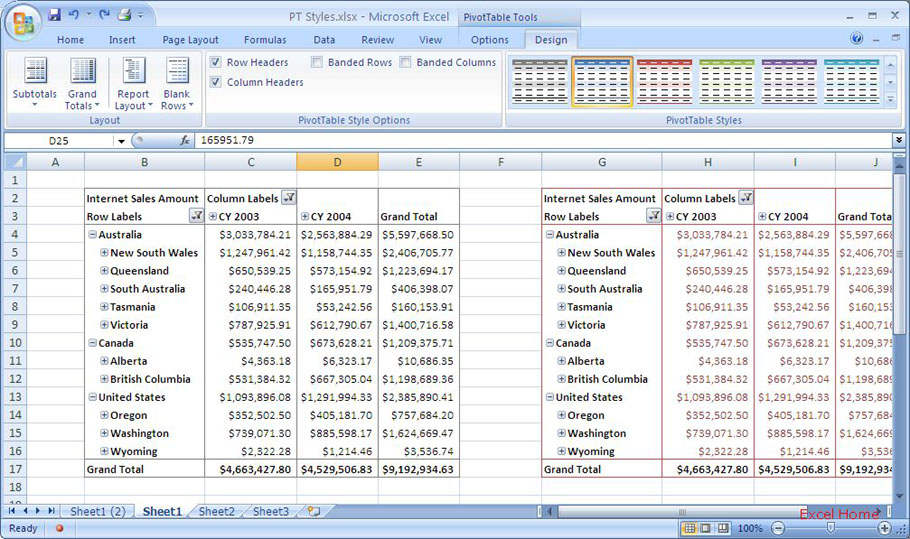
The only real difference between the PivotTable and Table Styles is with regards to the number of elements in a PivotTable style. Whereas Table Styles have 13 elements (headers, row banding, total rows, etc.), PivotTable styles have 25 elements. The additional elements are due to the fact that PivotTables are more complex than tables, so there are more table elements available for users to define formatting on. For example, you can define formatting for multiple levels of data, there are multiple levels of subtotals possible in a PivotTable, etc.
数据透视表与列表的风格真正的区别仅仅是,可用的元素的数量多少。虽然列表的风格共有13种元素可供利用(标题、行条纹、汇总行等),但是数据透视表风格却有25种元素之多。由于数据透视远较列表复杂,所以数据透视表得增加更多的元素,以便可供用户利用,实现各种格式设置。譬如,你可以在数据透视表中定义多种级别数据的格式,也可以设置尽可能的多种级别的分类汇总。
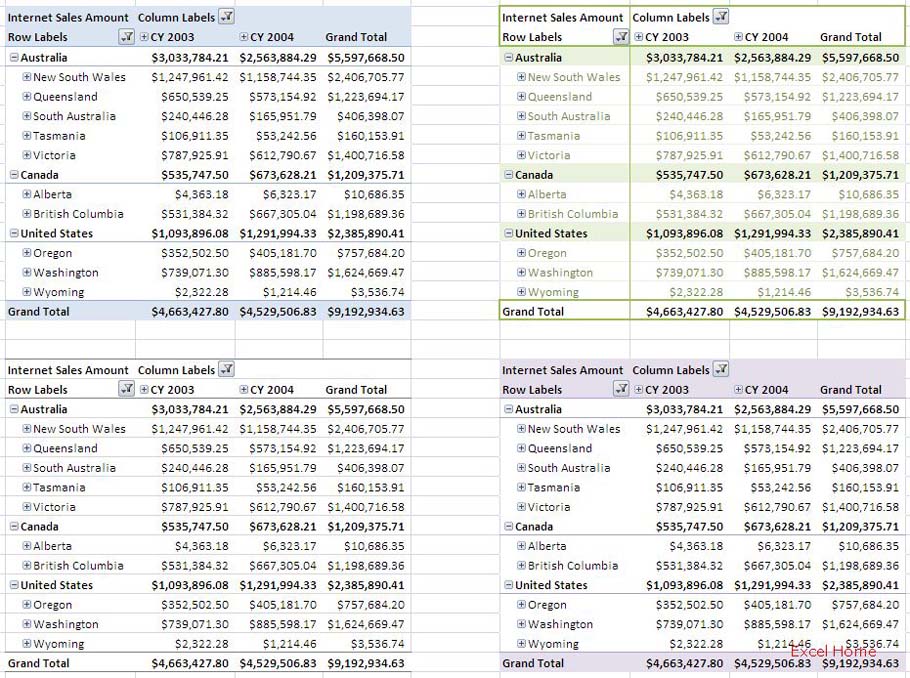
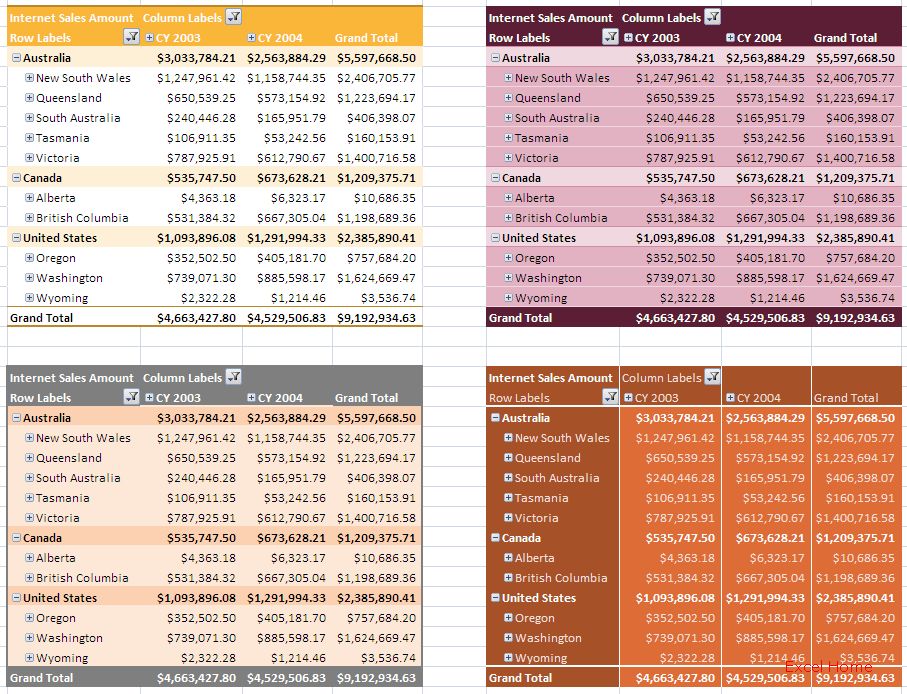
With that said, I wanted to leave you with some examples of PivotTables formatted with different default Styles. Again, I have tried to use a few of each of the Light, Medium, and Dark styles. One thing to note that is quite different when compared to Table Styles is the use of colour and font to identify levels in the data.
还是那句话,我应该带你欣赏几个不是默认风格的数据透视表范例,或者我尝试使用“明、中、暗”各种风格的不同形式创建数据透视表。需要注意的是,与列表风格相比较,数据透视表在颜色和字体上有很大的不同,实现区分不同级别的数据。
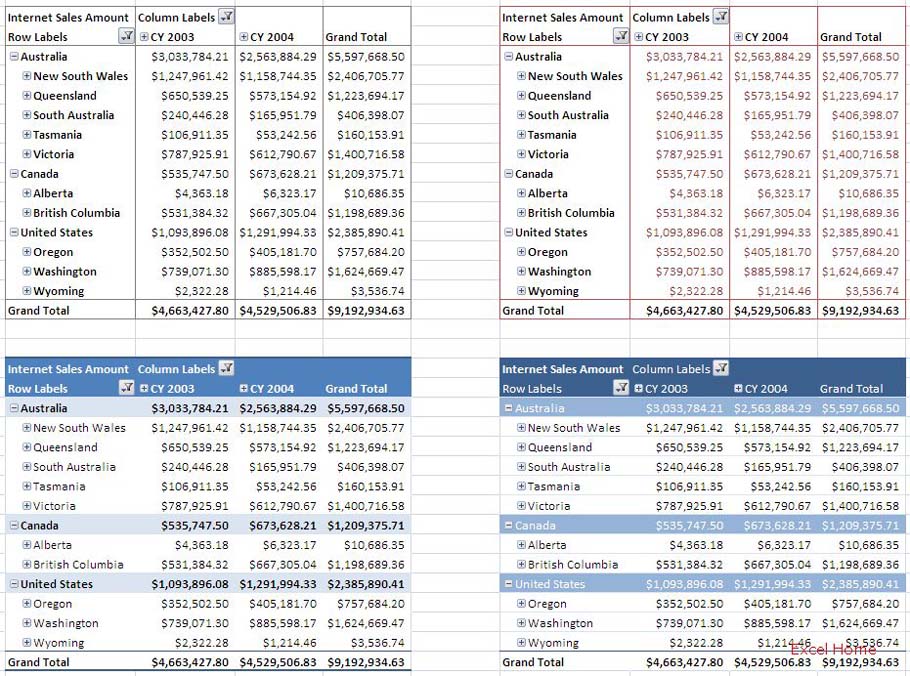

And, just for kicks, here is how a few of these styles look when converted to the “Opulent” Document Theme.
接着,这里有几个数据透视表在转换成“Opulent”Document Theme(“Opulent”文档主题)后的样式外观。
Once again, we are interested to hear from the PivotTable users out there … do these look good, or are there things you would like to see us change?
再次,我们对数据透视表用户反馈的意见很感兴趣,我们希望看到反馈,或者告诉我们您希望我们做出哪些改进?
Published Friday, March 31, 2006 4:11 PM by David Gainer
Filed Under: PivotTables, Formatting & Printing
注:本文翻译自http://blogs.msdn.com/excel ,原文作者为David Gainer(a Microsoft employee),Excel Home 授权转载。严禁任何人以任何形式转载,违者必究。