译者:hxhgxy 来源:http://blogs.msdn.com/excel
发表于:2006年7月7日
接上文:Excel2007新知:介绍SmartArt图形(一)
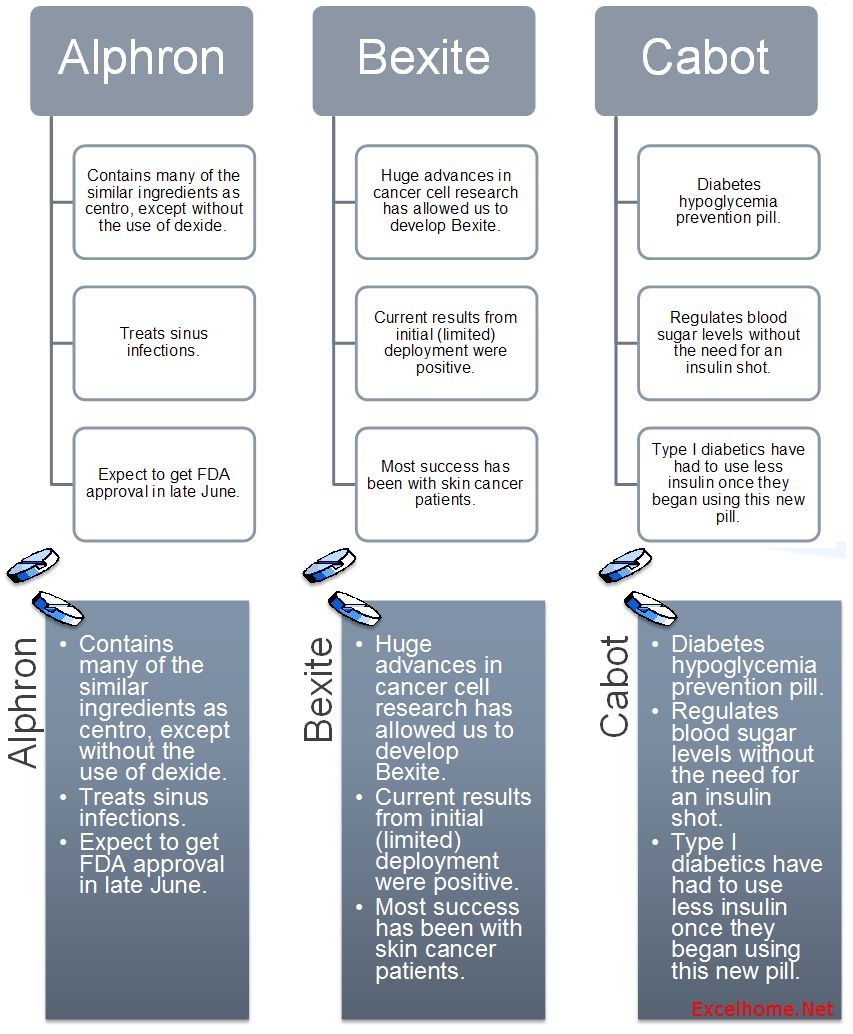
Each graphic has its own defined mapping between the text outline and the set of shapes. Notice how the same text (from the Text pane above) is mapped differently in two different layouts. In the top layout the sub-points are represented as separate shapes while in the second layout they are represented as bullets within the shapes:
每个图形有其自己设计好的文本和图形的组织方式。注意,相同的文本(从上面的文本窗格)在两个不同的布局里是如何不同布置的。在上面的布局里,分点代表为单独的图形,而在第二个布局里,它们代表为同一个图形里的项目编号:
The Text pane is designed to work like an outline or bulleted list. Pressing enter creates a new line, and using the promote and demote buttons on the ribbon (or pressing tab and shift+tab respectively on the keyboard) will indent or outdent the text on a line. All of these operations have a corresponding effect on the graphic. For example, depending on the graphic layout, hitting enter will create a new shape and demote will display a line of text as a bullet within a shape.
文本窗格设计来象一个大纲和项目编号列表一样工作。按下回车键创建新行,使用Ribbon上的升级和降级按钮(或者分别按下键盘上的tab和shift+tab键)将会增加或者减少一行上的文本缩进。所有这些操作都有一个相应的图形效果。例如,取决于图形布局,敲下回车键就会创建一个新图形,而降级则会在图形中显示一行带项目编号的文本。
Automatic sizing and positioning of shapes and text
图形和文本的自动大小和位置
By using the Text pane, you can focus on what you want to communicate without having to worry about sizing and positioning the shapes on the sheet. SmartArt Graphics does all that work for you. The “smarts” of SmartArt Graphics come in as you change the amount of text in a shape or bulleted list and in the number of shapes. And, by the way, those changes do not have to be confined to the Text pane. All edits can also be made within the shapes in the canvas too.
通过使用文本窗格,你可以关注你想要交流的信息,而不必担心工作表上图形的大小和位置。SmartArt图形会为你搞定所有的事情。当你在大量图形里更改大量的文本或者清单时,就能体会到SmartArt图形的“智能”了。顺便说一下,那些更改不必一定在文本窗格里进行,所有的编辑也可以直接在图形里进行。
The goal of SmartArt Graphics is for the resulting visual to always look professional. As more text is added to one shape, for example, the font size may decrease to make sure that the text fits inside of the shape (or the shape itself might grow). In addition, if the text of one shape shrinks then all of the other text in the graphic will also shrink to be the same size, in order to keep the graphic looking consistent and professional. A template may show only three shapes, for example, by default but often it will allow additional shapes to be added and the graphic will update automatically.
SmartArt图形的目的是让最后的视觉效果总是看上去很专业。例如,因为一个图形了添加在太多的文本,所以文字大小会减小,以确保文本适应图形大小,而不是图形(或者图形自己可能增大)适应文本。另外,为了保证图形看上去一致和专业,如果某个图形的文本缩小在,那么该图形里的所有其它文本也会缩小为同样大小。例如,一个模板缺省地仅显示三个图形,但是,它经常允许添加额外的图形,并且该图形会自动更新。
Seamless switching between layouts
布局之间无痕迹的自由切换
There will be times when one layout does not capture the message you are trying to convey. At any point, you can switch to another layout. So if you didn’t like having all of the text in separate shapes, you can switch to a different layout that shows all of the text as bullets. Or if you decide that the workflow you are presenting is really a repetitive process you might switch from a simple horizontal flow diagram to a circular diagram. Leveraging the power of live preview, you can just move your mouse over any of the different layouts displayed in the ribbon and you’ll see what your content will look like with that template applied. Some layouts are just not meant for certain sets of data. Live preview allows you to try on different layouts until you find the one that best communicates your message.
有些时候,一个布局不能捕捉你想要表达的信息。在任何时候,你都可以切换到另外一个布局。因此,如果你不喜欢在分开的图形里显示文本的话,那么你可以切换到一个不同的布局里,将文本显示为项目编号。或者,如果你觉得你要展示的工作流程确实是个重复性的过程,那么你可以从一个简单的水平流程图切换到一个环形图。充分利用在线预览功能,你可以将鼠标移动到显示在彩带上的任何不同的布局上去,你将看到应用该模板后将显示的内容样子。某些布局对某些数据上不适用的。在线预览允许你试验不同的布局,直到你找到最好沟通你信息的模板。
Like most of the other posts detailing features for great-looking documents, SmartArt Graphics is not just available in Excel but also in PowerPoint, Word, and Outlook. In PowerPoint 2007, there is also a button to automatically convert a standard bulleted list on a slide into a SmartArt Graphic and animations can be applied to the graphic (e.g., to display shapes one at a time or one level at a time).
正如大多数其它介绍美化文档外观的功能一样,SmartArt图形不仅在Excel里可用,而且在PowerPoint,Word和Outlook里也可用。在PowerPoint 2007里面,有个按钮,可以将标准按项目编号列出的清单转换为SmartArt图形,并且可以将动画应用到该图形(例如,每次显示一个图形,或者每次显示一级图形)。
Go ahead and take advantage of the new rich charting functionality when it comes to your regular data but when you have to communicate something more abstract just head a little to the left on the Insert tab. With SmartArt Graphics you’ll be able to quickly and easily capture and present your ideas in new ways.
当需要时,赶紧好好利用这个丰富图表的新功能吧,但是当你必须表达一些更抽象的东西时,那么在“插入”页的左边添加一些标题吧。有了SmartArt图形,你将能够以新的方式快捷轻松地捕捉和表达你的点子。
In the next post on SmartArt Graphics, I’ll go into how to quickly turn a default graphic into something that really looks like you had a graphic designer’s help . . . say, something like this:
在下篇关于SmartArt图形的帖子里,我将探究如何快速地将一个缺省的图形转换为真正看上去就像有图形设计者帮你做的东西……也就是说,一些如下所示的东西:
Published Monday, May 15, 2006 10:56 AM by David Gainer
Filed Under: Integration With Word and PowerPoint, SmartArt
注:本文翻译自http://blogs.msdn.com/excel ,原文作者为David Gainer(a Microsoft employee),Excel Home 授权转载。严禁任何人以任何形式转载,违者必究。