译者:snood 来源:http://blogs.msdn.com/excel
发表于:2006年7月7日
图表四:PowerPoint和Word中的图表
One thing we know is that many of the charts that folks created in Excel end up in PowerPoint presentations or Word documents (I think the statistic is that 50% of all charts in PowerPoint presentations originate from Excel. While users work in Excel to analyze their data, the final results are often given to others, and they rarely want to include all the intermediate steps from Excel. Furthermore, users have all kinds of solutions to transfer their charts. Most just use copy and paste, but some use Excel’s copy as picture command, or write VBA solutions, to update their charts in various ways. In Office 2007, our goal was to make copying and pasting charts into PowerPoint and Word as easy as possible. We also wanted the resulting charts to be as easy to use in PowerPoint and Word as they are in Excel, and we wanted to address a lot of problematic behaviours that existed in current versions of Office when you moved charts from Excel to PowerPoint one way or another. Today I am going to briefly review the work that we did in this area.
我们知道有很多图表是在Excel中创建,然后在PowerPoint或 Word中使用(我觉得PowerPoint中大约有50%的图表是来自Excel的)。当用户使用Excel进行数据分析时,最后的报表往往不包含中间步骤,而是将最终结果交给别人。 此外,用户还会使用各种各样的方式传递图表。最多的就是使用拷贝和粘贴,也有些用户会用Excel的“复制为图片”命令,或写VBA解决方案,以各种方式来更新图表。在Office 2007中, 我们的目标是使复制并粘贴图表到PowerPoint 和Word中易如反掌。我们也希望此图表在PowerPoint 和Word中的使用与在Excel中一样方便。在当前Office版本中,当你用某种方式移动Excel图表到PowerPoint中时,我们要解决很多问题。今天我想简单地回顾一下这方面的内容。
Charts as OfficeArt Shapes
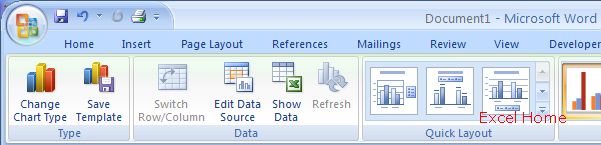
At the core of all the improvements we have made in this area, charts in PowerPoint 2007 and Word 2007 are just like charts in Excel 2007. They are native objects in PowerPoint and Word, just like they are in Excel, and as a result, the user experience and behaviour is pretty much identical in all three applications. They have the same themes, chart types, layouts, and styles that were discussed in the last article. They even have almost the identical ribbons and dialogs as Excel 2007. Here is a screenshot of charting in Word 2007 in a near-beta-2 build. You can see how this is identical to what we looked at in Excel 2007 last week.
我们在这方面改进的核心是:在PowerPoint 2007和Word 2007中使用图表有如在Excel中使用图表。在PowerPoint和Word中图表是默认对象,就像在Excel中一样。在三种不同的应用程序中其制作方法和过程基本相同,他们有同样的源数据,图表类型,布局和风格,也有与Excel 2007几乎相同的Ribbon和对话框。 这是一张Word 2007 beta-2的图表截图, 你可以看到这与我们上一篇里Excel 2007图表是多么相似。
(Click to enlarge)
The chart’s default theme will come from the presentation or document, just as it does from the spreadsheet’s theme in Excel. This ensures that your charts will match the rest of your document, whichever of the three applications you are using.
For Office developers, the entire chart object model from Excel is now available for charts in Word and PowerPoint too. With a few modifications, it’s possible to migrate solutions that used the Microsoft Graph object model over to the new charts, although you can keep using Graph should you not want to migrate your code.
图表的默认源数据将来自幻灯片或文档,就象Excel中源数据来自工作表一样。 这保证你的图表与文档相符合, 你用三个应用程序中的无论哪一个进行Office开发,整个Excel图表对象模型现在也可在Word和PowerPoint中应用。会有一些修改,新的图表移植解决方案中会使用微软的图表对象模型,虽然可以继续使用图表,但是不能移植代码。
Data for Charts
图表数据
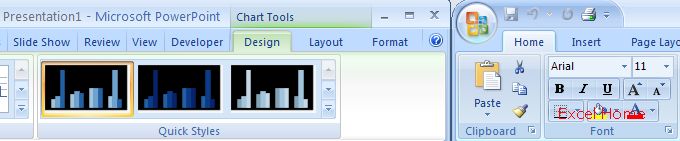
There is one big difference, of course, between charts in Excel and charts in Word and PowerPoint – Word and PowerPoint don’t have a grid for the data. The solution to that in Office 2007 is to use Excel for the chart data in all three applications. When you create a chart in PowerPoint, PowerPoint and Excel tile side by side. You can type the data in Excel, and watch the chart update in PowerPoint. Better still, you can use the full power of Excel for all charts, including formulas, connections to external data sources, and sorting & filtering. When you are done entering the data, you can close Excel, and PowerPoint will return to full size. In this case, the Excel spreadsheet containing your data is embedded in your PowerPoint document in case you need to edit it later.
在Excel中作图与在Word 和PowerPoint中作图有一个很大的不同:Word 和PowerPoint没有数据表格。在Office 2007中解决这个问题的办法是在这三个应用程序中都使用Excel表格作为数据源。当你在PowerPoint中创建图表时Excel和PowerPoint的标题栏会并列显示。 你可以在Excel中输入数据,在PowerPoint中观看图表的更新。 更好的是,你可以充分利用Excel的所有功能来表现图表,包括公式、连接外部数据源,排序和筛选。当你输完数据,你可以关闭Excel,PowerPoint将恢复实际大小。在这种情况下,包含了数据的Excel表格是内嵌在PowerPoint中的,以后如果需要可以随时进行修改。
(Click to enlarge)
You can also have a chart with data linked to an external file. This allows you to update your document with the latest data from your spreadsheet, whenever you wish. It also lets you share a document with someone else, without them needing the spreadsheet containing your calculations. They can even change the presentation and the chart formatting, and then you can update the data later. We think this is a valuable scenario. For those familiar with OLE linking & embedding for charts in previous versions of PowerPoint, it is important to remember that the chart is always part of the presentation, it is only the data that linked or embedded. Therefore, you can edit the chart fully in PowerPoint – you only need the embedded or linked spreadsheet when you try to edit the data. All of the above also applies to Word.
您也可以将图表数据源与外部数据连接。只要你愿意,你就可以更新文档为最新数据表。你也可与别人共享文件,他们需要你的数据计算。他们甚至可以改变幻灯片和图表格式,然后就可以更新数据。我们认为这是一个很有价值的情况. 对于前在一个PowerPoint版本中熟悉的Ole连结和内嵌图表, 图表是幻灯片中重要的一部分,这只是数据连结和内嵌。因此, 当你要编辑数据时,你完全可以在PowerPoint中编辑图表,只需要连结和内嵌数据表就行了。以上也适用于Word.
Copy and Paste of Charts
The primary way to transfer a chart from Excel to PowerPoint or Word is by copying them in Excel and pasting them into the presentation or document. This is a full fidelity paste – the chart will look exactly the same as it did in Excel. It is also the same on screen and when printed. No more funny sizing problems, and because the chart is a native object in PowerPoint, all the PowerPoint features and tools just work.
When you paste the chart into PowerPoint or Word from Excel, a smart tag appears that gives you several different paste options.
拷贝和粘贴图表
将Excel图表转移到Word 和PowerPoint的主要方法是在Excel中复制,然后粘贴到幻灯片或文档中。 这是最完全的复制:图表与Excel中的完全相同。 不管是屏幕显示还是打印效果都一样。更没有尺寸的问题,因为图表是PowerPoint的默认对象,所有PowerPoint的工具和特性都正常。当你将Excel图表粘贴到Word 和PowerPoint时,会显示智能标签,让你选择不同的选项。
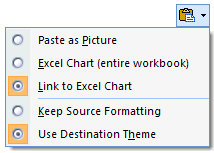
The second and third choices are to have embedded or linked data (as described in the previous section). The last two choices also allow you to choose between the theme in the source spreadsheet, and the theme in the destination document. You can keep your chart exactly as you had it in Excel, or make it automatically match the rest of your presentation. The first choice allows you to choose to paste the chart as a picture in PNG format. In that case, the chart can no longer be edited.
第二和第三个选项是选择连接或嵌入数据(如前一节)。最后两个选项是让你选择这个图表的源数据是在数据表还是在目标文件中。你可以显示图表与Excel中一样,或者自动配合你的幻灯片。第一个选项让你选择粘贴图表为PNG格式. 在这种情况下,就不能再编辑图表了。
Microsoft Graph
Some of you may be wondering what happened to Microsoft Graph. Microsoft Graph still exists in Office 2007, and it’s identical to previous versions (meaning that none of the improvements to charting have been added to Microsoft Graph). Users of Microsoft Graph in Microsoft Access, for example, will find nothing has changed. Microsoft Word documents in “compatibility mode”(more on what that is in a later post) continue to use Microsoft Graph as well. PowerPoint and Word users who don’t have Excel will also get Microsoft Graph. Finally, users can continue to use Insert Object to insert a Microsoft Graph object into any OLE application.
Microsoft Graph
你可能有些奇怪Microsoft Graph发生了什么变化。Microsoft Graph在Office 2007中仍然存在,它的前几个版本都相同(即Microsoft Graph没有任何改进). Microsoft Graph用户在使用微软Access时,认为一切都没有改变. 微软Word文档在”兼容模式”时(更多的东西,后面继续讨论。)继续利用Microsoft Graph较好. PowerPoint和Word用户即使没有Excel也可通过Microsoft Graph制作图表。最后,用户可以继续使用插入一个Microsoft Graph对象到任何OLE应用程序。
Charts and Excel Services
I’ve talked about and emphasized that workbooks on the client look as similar as possible in the browser. Charts, too, can be generated on the server. Currently, Excel services does not support 3D charts, and it does not support all of the OfficeArt formatting options from the client. However, charts in the browser have a high degree of fidelity with charts in Excel.
图表和Excel服务器
我们主要讨论:在客户机上的工作簿在浏览器中显示。图表也可以在服务器上生成。目前, Excel服务器并不支持3D图表,也不支持OfficeArt格式的所有选项。不过,在浏览器中的图表与Excel图表是非常接近的。
Published Monday, April 17, 2006 1:15 PM by David Gainer
注:本文翻译自http://blogs.msdn.com/excel ,原文作者为David Gainer(a Microsoft employee),Excel Home 授权转载。严禁任何人以任何形式转载,违者必究。